The Conprism: The Illusion of Precision in Estimates and Star Ratings

On this page2 sections ▾
I was thinking recently about rating scales. When you're asked to give a rating on a 10-point scale, what's the real difference between a 7 and an 8? It's splitting hairs, and the actual feeling gets lost in the search for an arbitrary number.
It made me think about how often we run into this same pattern at work. We trust data and precision, assuming that more granularity means more accuracy.
More options can make the answer look more precise without making it more useful.
#What I mean by conprism
“Conprism” started as a typo while I was trying to write “comparison”. I kept it because it gave me a name for the false precision I was trying to describe.
A conprism is a lens that gives you a false sense of precision - you think you're being more accurate than you really are. Like looking through a pane of glass that isn't perfectly flat. The view is clear enough, but the details are slightly off.
This shows up a lot in work estimates and user ratings.
#Through the Conprism of Work Estimates
In software development, we often get asked how many hours a feature will take. An exact number is convenient for planning, even when the work is still uncertain.
But when we ask for hour-level estimates on complex, uncertain work, we're looking straight through the conprism.
- 1 hour vs. 2 hours? You can feel that difference.
- 5 hours vs. 8 hours? Harder, but still tangible.
- 80 hours vs. 120 hours? At that size, I'd want to understand the unknowns before treating the difference as reliable.
The problem is that those arbitrary numbers get treated as commitments. They become the "source of truth," even when that truth is shaky. Teams start sandbagging to protect themselves, and stakeholders build plans on confidence that was never really there.
#Estimating with room for uncertainty
The fix is to use tools that acknowledge uncertainty rather than pretend it doesn't exist. Agile teams have been doing this for years:
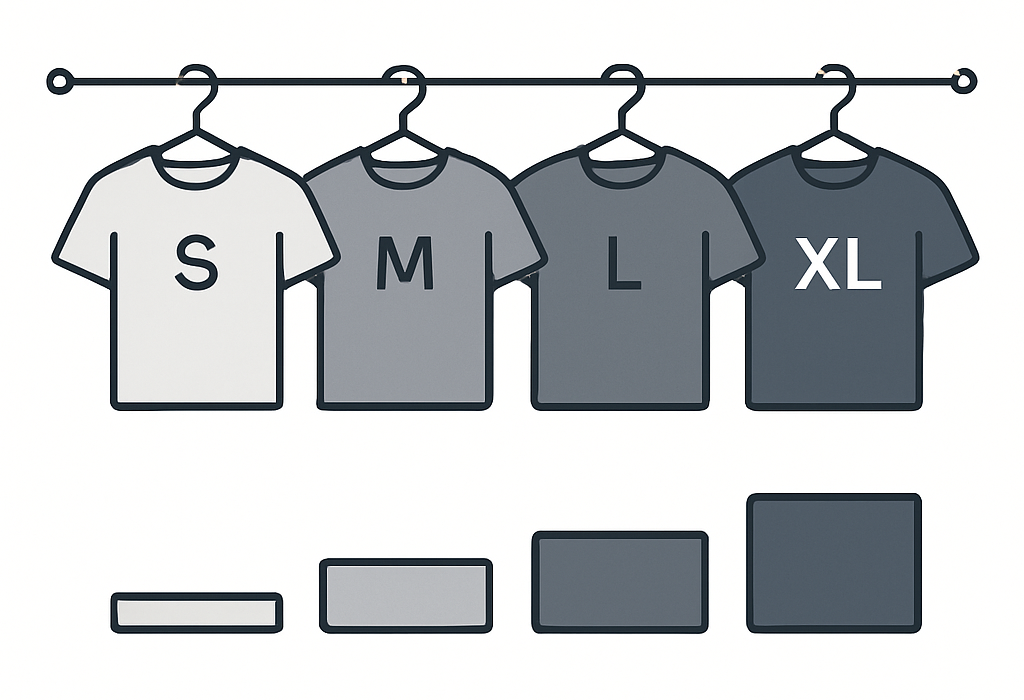
- T-shirt sizing: estimate in Small, Medium, Large. A "Large" task is clearly bigger than a "Small" one, and that's often all you need to make a sensible decision.
- Fibonacci sequencing: story points like 1, 2, 3, 5, 8, 13... The widening gaps between numbers are the point. The jump from 13 to 21 forces a conversation about what you don't know yet. That conversation is worth way more than arguing over whether something is 18 or 19 hours.

Both approaches do the same thing: they make uncertainty part of the conversation instead of sweeping it under the rug.
#Through the Conprism of Ratings
The conprism doesn't just distort project plans. It messes with how we collect feedback too.
A simple like/dislike feels too blunt. But a 10-point scale goes too far the other way.
#Why I prefer a five-point scale
For the service and product feedback I'm describing, five points gives me enough room to express a view and explain what each rating means:
⭐️ (1): Terrible.
⭐️⭐️ (2): Not great.
⭐️⭐️⭐️ (3): It was fine. (This neutral option is so important!)
⭐️⭐️⭐️⭐️ (4): Good.
⭐️⭐️⭐️⭐️⭐️ (5): Loved it!
That neutral 3-star option matters more than people give it credit for. It gives someone who doesn't feel strongly either way a place to put that answer. Without it, their choice may imply a preference they don't have. "Most of our users are meh about this" is genuinely useful to know.
With a 10-point scale, the conprism is back. Try defining every level and you'll see why:
⭐️ (1): Terrible.
⭐️⭐️ (2): Really not good.
⭐️⭐️⭐️ (3): Pretty bad.
⭐️⭐️⭐️⭐️ (4): More bad than good.
⭐️⭐️⭐️⭐️⭐️ (5): Perfectly average, leaning towards disappointment. (Negative Meh)
⭐️⭐️⭐️⭐️⭐️⭐️ (6): Perfectly average, leaning towards pleasant. (Positive Meh)
⭐️⭐️⭐️⭐️⭐️⭐️⭐️ (7): Good.
⭐️⭐️⭐️⭐️⭐️⭐️⭐️⭐️ (8): A bit better than good.
⭐️⭐️⭐️⭐️⭐️⭐️⭐️⭐️⭐️ (9): Genuinely great.
⭐️⭐️⭐️⭐️⭐️⭐️⭐️⭐️⭐️⭐️ (10): Excellent, perfect.
What does "Negative Meh" vs. "Positive Meh" actually mean to the person clicking the button? Without shared definitions, respondents can interpret the difference between 5 and 6, or 7 and 8, differently. You end up with data that looks precise but is really just a collection of inconsistent gut feelings dressed up as numbers.
For work estimates, I'd rather have a size that starts a useful discussion about uncertainty than an hour count that implies more confidence than we have. For ratings, I want each option to mean something I can explain, including a neutral answer. Those are the checks I'd make before adding more points to either scale.